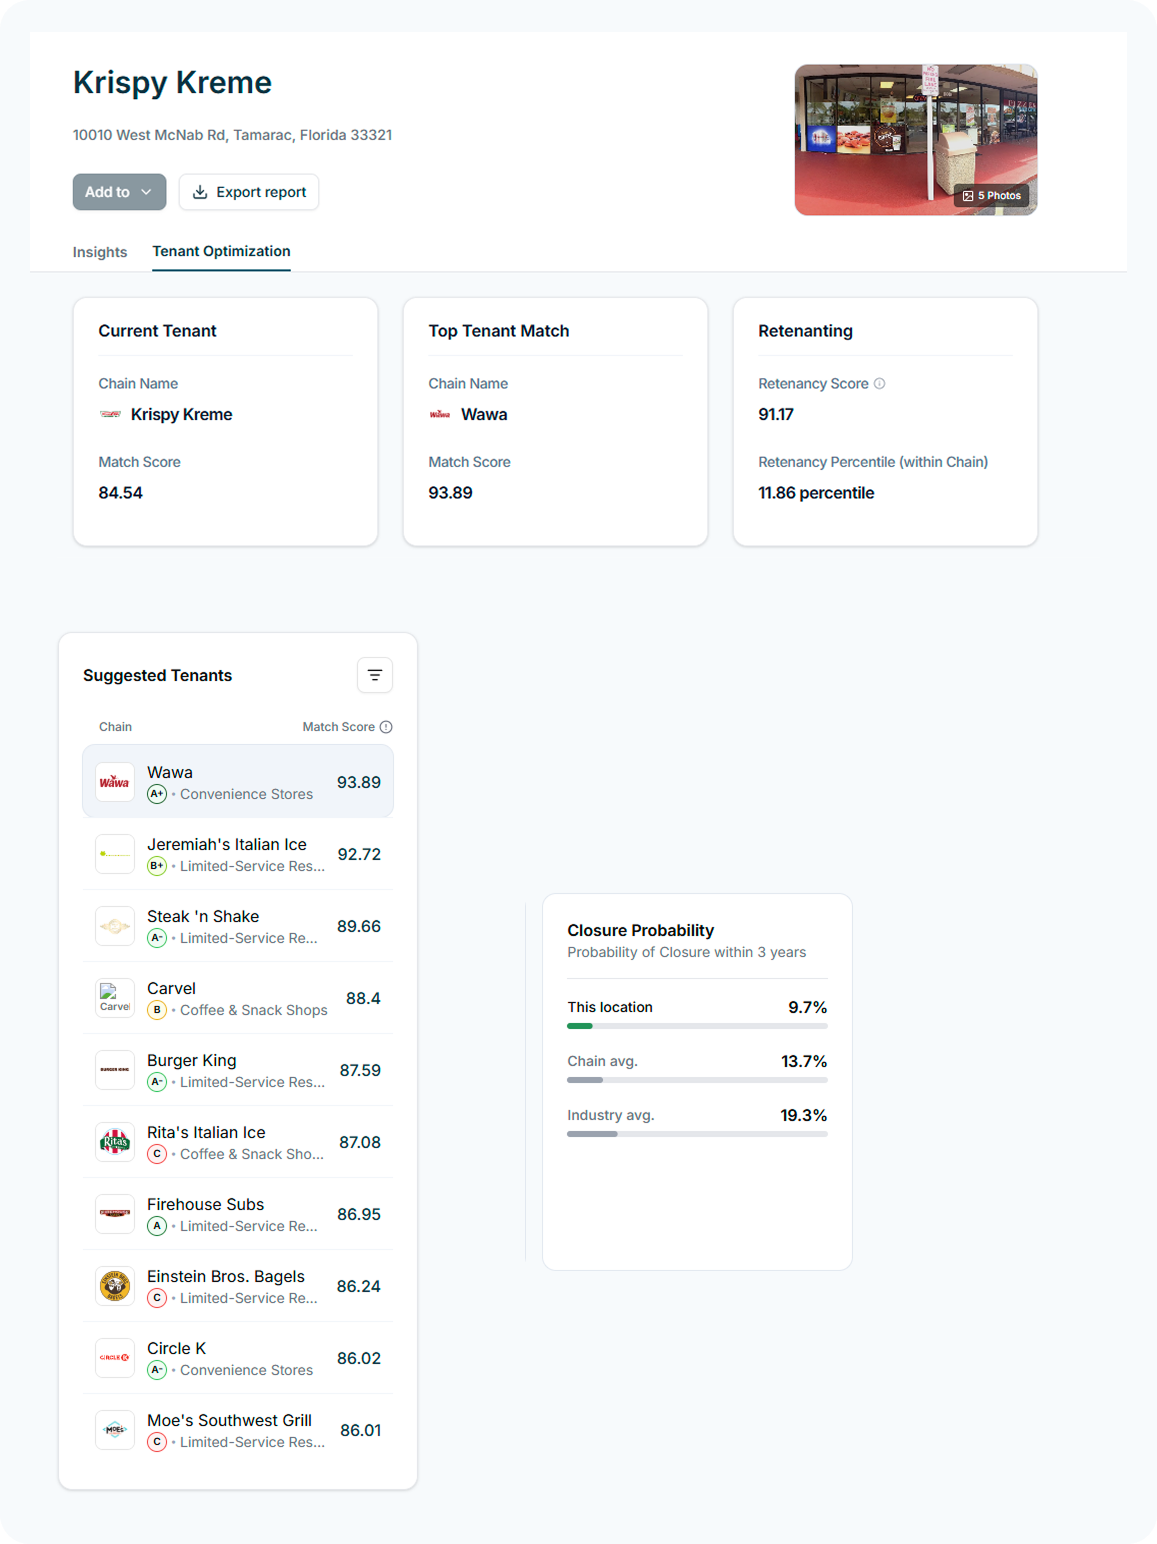
The Real Estate X-Ray. CFS synthesizes billions of data points into a single, actionable read on every tenant's likelihood to stay, leave, or struggle — property by property, ahead of every renewal.

We are continually expanding our reach, and cover all the major industries and tenants traded in the retail net lease space.
CFS produces a structured, defensible answer to each — at the property level, refreshed continuously, scored against the same engineered feature set.
A property-specific probability, refreshed continuously, that surfaces 6–18 months ahead of expiry — not a chain-level heuristic.
The five to ten operational, demographic, competitive, real estate, and corporate health signals most responsible for the score, ranked by contribution with a plain-language explanation.
A ranked list of viable replacement tenants for the specific box, with a probability distribution and time-to-lease estimate, scored against the same property-level features as renewal.
The best ammunition for lease negotiations. CFS tells you which tenants are at risk, which are strong, and which can handle aggressive rent growth — so you push the right button with the right tenant at the right time.
Closure probability is just the start. CFS models what happens next: NOI impact, vacancy duration, re-leasing economics, and how surrounding tenants are affected. See the full portfolio consequence of every lease decision.
A cross-section of what CFS delivers at the property level. Every output is powered by the same underlying model.
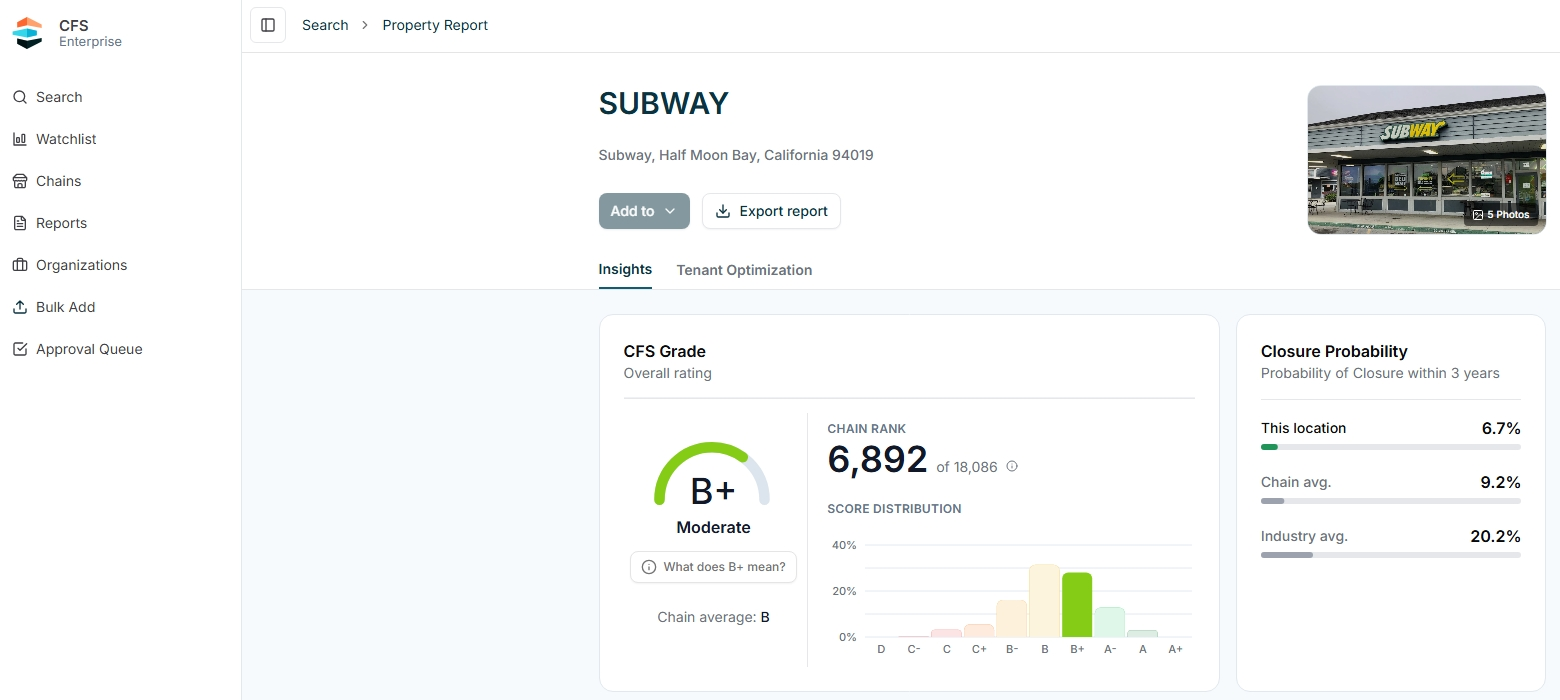
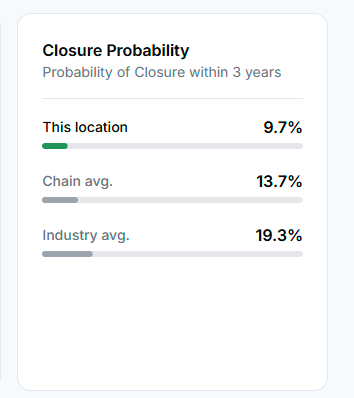
A retailer-specific 3-year closure probability, trained on billions of historical closure, relocation, and expansion patterns. The most granular lease durability score ever built for commercial real estate.


A holistic view of a retailer's strength across its entire physical footprint. Every location scored simultaneously — giving investors a clear picture of where a chain is strong, where it's vulnerable, and how that shapes asset value. See how any individual location ranks within its chain across thousands of locations.
Every score is explained by key drivers ranked by impact — data points such as foot traffic trends, demographics, competitive density, cannibalization risk, income levels, and more. For each driver, we show whether it's pushing this specific tenant toward closure or toward renewal at this specific location.


If we can predict closure, we can predict the inverse: which retailers would thrive in this box. Void Analysis scores every top retailer on tenant-property fit (0–100), surfacing the strongest replacement candidates for any location.
The best ammunition for lease negotiations. CFS tells you which tenants are at risk, which are strong, and which can handle aggressive rent growth — so you push the right button with the right tenant at the right time.
Every property gets a CFS Grade (A+ to D) based on its closure probability percentile across our entire retailer universe. A+ = less than 2% closure probability within a 3-year horizon (top 18% of all retailers). D = greater than 50% closure probability within a 3-year horizon (bottom 1%). Know instantly where your property ranks.